Create a static HTML page for the Preview
NOTE : This change refers to Sitools2 - v2.4
With the SZ-DB Cluster Database release of March, 12th, 2015, it has been enabled the possibility to visualize the Planck y-map, the WISE image, the WISE density map and the ROSAT map for each cluster, by clicking on the Preview icon ![]() .
.
The link opens a static HTML page, specific for the cluster, containing the images and a small summary table: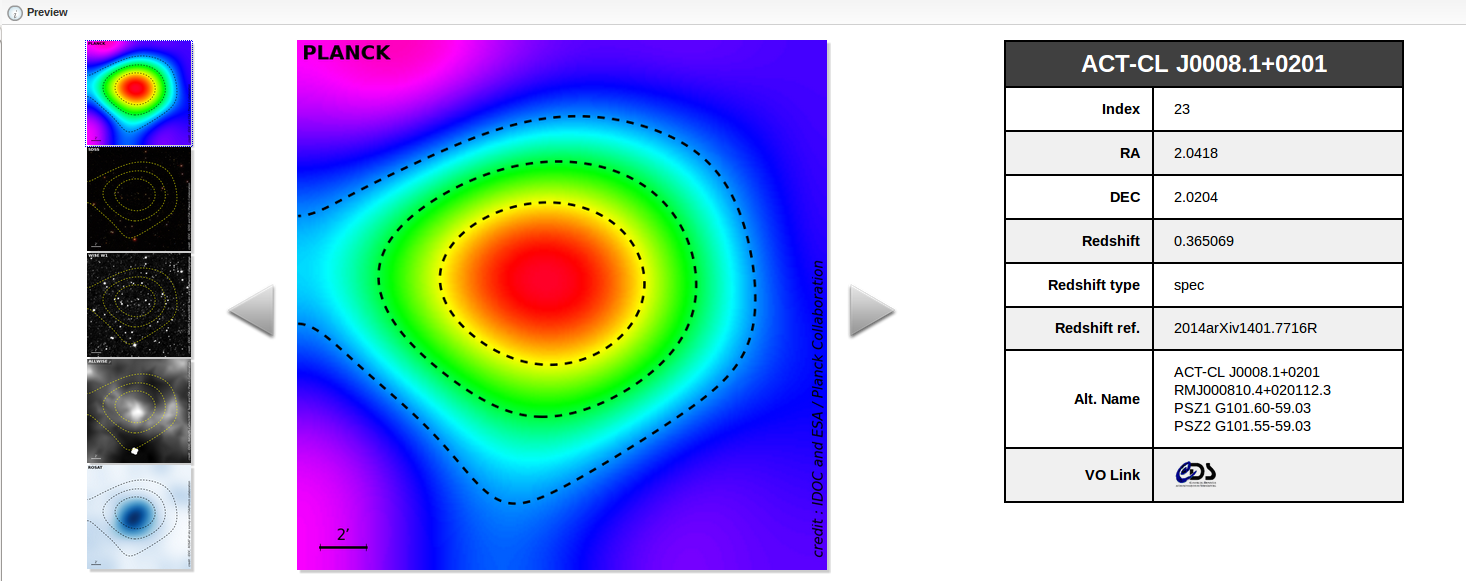
The HTML code of the above page is provided as an example at:
source:git_sitools_idoc|szcluster-db/preview_page/index_23.html@02b38c6f
To automatically generate the HTML pages for all the clusters of a dataset directly from the PostgreSQL database, use the python script:
1. Customize the part related to the PostgreSQL database1:
 dbname = "'<DB_NAME>'"
 user = "'postgres'"
 host = "'localhost'"
 pwd = "''"
 dataset = "'<DATASET_NAME>'"
2. Put all the unpacked images (named as SZ_<index>_SZ*.png) in ./images/ folder.
3. Be sure the folder ./html/ exists.
4. Launch the script:
$ python generate_html_from_template_and_PostgreSQL_db.py
1 By default, the script assumes the database is local. To read the data from a distant server, just change user and host.