Enhanced project graph editor for admin interface » History » Version 2
« Previous -
Version 2/6
(diff) -
Next » -
Current version
Anonymous, 14/09/2015 17:59
Enhanced project graph editor for admin interface
This is a enhanced project graph editor for admin interface.
In Sitools by default you can only add simple node (with no function) and dataset node in the "project graph" generator.
With this enhanced version you can link a node to a dataset and access to the fontions of this dataset (show data table, query form...)
The new node editor looks like:
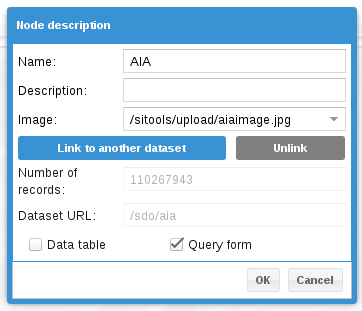
As you can see in the picture, you can do "link", "unlink" and select the fonction to display the data.
How to:
- Get the code from here:
- Replace the code of yourPathTo/workspace/client-admin/js/graphs/GraphsNodeWin.js with the code you just downloaded.