Show data on Google Maps
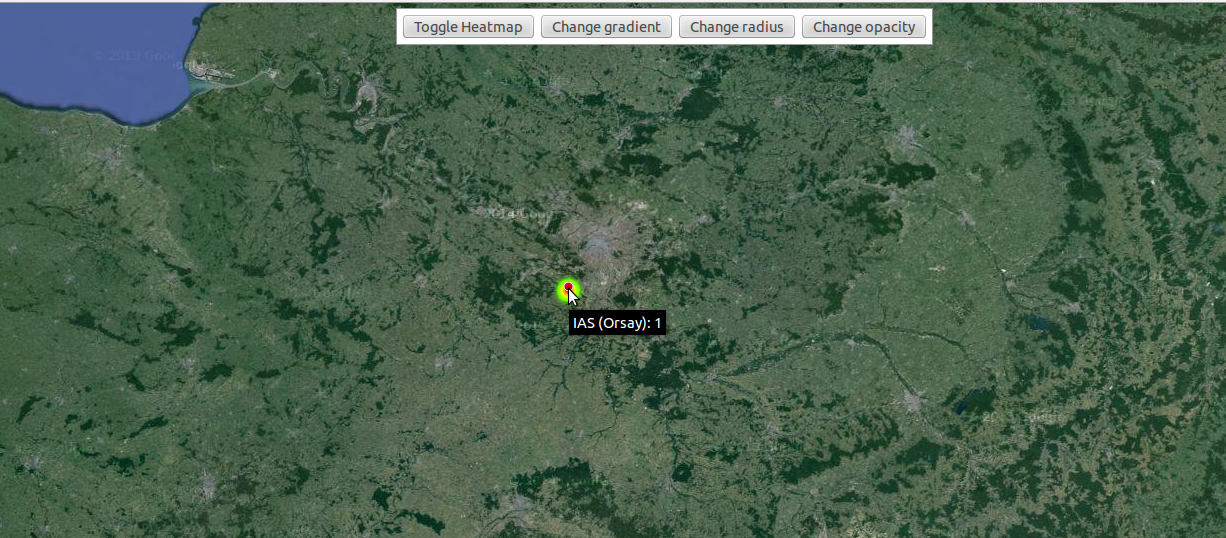
The following HTML code uses the Google Maps API to display data as Heatmap + Marker.
Additional information are also provided when the cursor is put on the marker.
<!DOCTYPE html>
<html>
  <head>
    <meta charset="utf-8">
    <title>Heatmaps</title>
    <style>
      html, body, #map-canvas {
        height: 100%;
        margin: 0px;
        padding: 0px
      }
      #panel {
        position: absolute;
        top: 5px;
        left: 50%;
        margin-left: -180px;
        z-index: 5;
        background-color: #fff;
        padding: 5px;
        border: 1px solid #999;
      }
    </style>
    <script src="https://maps.googleapis.com/maps/api/js?v=3.exp&signed_in=true&libraries=visualization&sensor=true"></script>
    <script>

// This example creates a heatmap + marker on the map, over the IAS
var map, pointarray, heatmap;

var citymap = {};

citymap['IAS'] = {
  title: 'IAS',
  center: new google.maps.LatLng(48.698972, 2.174751),
  visits: 1,
  city: 'Orsay',
  country: 'France'
};

// Create the heatmap gradient with five points
var ipData = [
  new google.maps.LatLng(48.698972, 2.174751),
  new google.maps.LatLng(48.698972, 2.174751),
  new google.maps.LatLng(48.698972, 2.174751),
  new google.maps.LatLng(48.698972, 2.174751),
  new google.maps.LatLng(48.698972, 2.174751),
];

function initialize() {

  // Centering and type of shown map
  var mapOptions = {
    zoom: 7,
    center: new google.maps.LatLng(48.698972, 2.174751),
    mapTypeId: google.maps.MapTypeId.SATELLITE //TERRAIN
  };

  map = new google.maps.Map(document.getElementById('map-canvas'),
      mapOptions);

  // Construct the marker for each value in citymap (just one, in this case).
  for (var city in citymap) {
    var contentString = citymap[city].title+' ('+citymap[city].city+')'+': '+citymap[city].visits;
    var populationOptions = {
      map: map,
      position: citymap[city].center,
      title: contentString,
      icon: 'http://szcluster-db.ias.u-psud.fr/sitools/upload/locMarker_redCircle.gif',
    };

    // Add the circle for this city to the map.
    cityCircle = new google.maps.Marker(populationOptions); //Marker

  }

  var pointArray = new google.maps.MVCArray(ipData);

  heatmap = new google.maps.visualization.HeatmapLayer({
    data: pointArray,
    dissipating: 1,
    opacity: 1,
    maxIntensity:5,
    radius: 15
  });

  heatmap.setMap(map);
}

function toggleHeatmap() {
  heatmap.setMap(heatmap.getMap() ? null : map);
}

function changeGradient() {
  var gradient = [
    'rgba(0, 255, 255, 0)',
    'rgba(0, 255, 255, 1)',
    'rgba(0, 191, 255, 1)',
    'rgba(0, 127, 255, 1)',
//     'rgba(0, 63, 255, 1)',
//     'rgba(0, 0, 255, 1)',
//     'rgba(0, 0, 223, 1)',
//     'rgba(0, 0, 191, 1)',
//     'rgba(0, 0, 159, 1)',
//     'rgba(0, 0, 127, 1)',
//     'rgba(63, 0, 91, 1)',
//     'rgba(127, 0, 63, 1)',
    'rgba(191, 0, 31, 1)',
//     'rgba(255, 0, 0, 1)'
  ]
  heatmap.set('gradient', heatmap.get('gradient') ? null : gradient);
}

function changeRadius() {
  heatmap.set('radius', heatmap.get('radius') ? null : 10);
}

function changeOpacity() {
  heatmap.set('opacity', heatmap.get('opacity') ? 0.8 : 1);
}

google.maps.event.addDomListener(window, 'load', initialize);

    </script>
  </head>

  <body>
    <div id="panel">
      <button onclick="toggleHeatmap()">Toggle Heatmap</button>
      <button onclick="changeGradient()">Change gradient</button>
      <button onclick="changeRadius()">Change radius</button>
      <button onclick="changeOpacity()">Change opacity</button>
    </div>
    <div id="map-canvas"></div>
  </body>
</html>
The browser will display the HTML in this way: